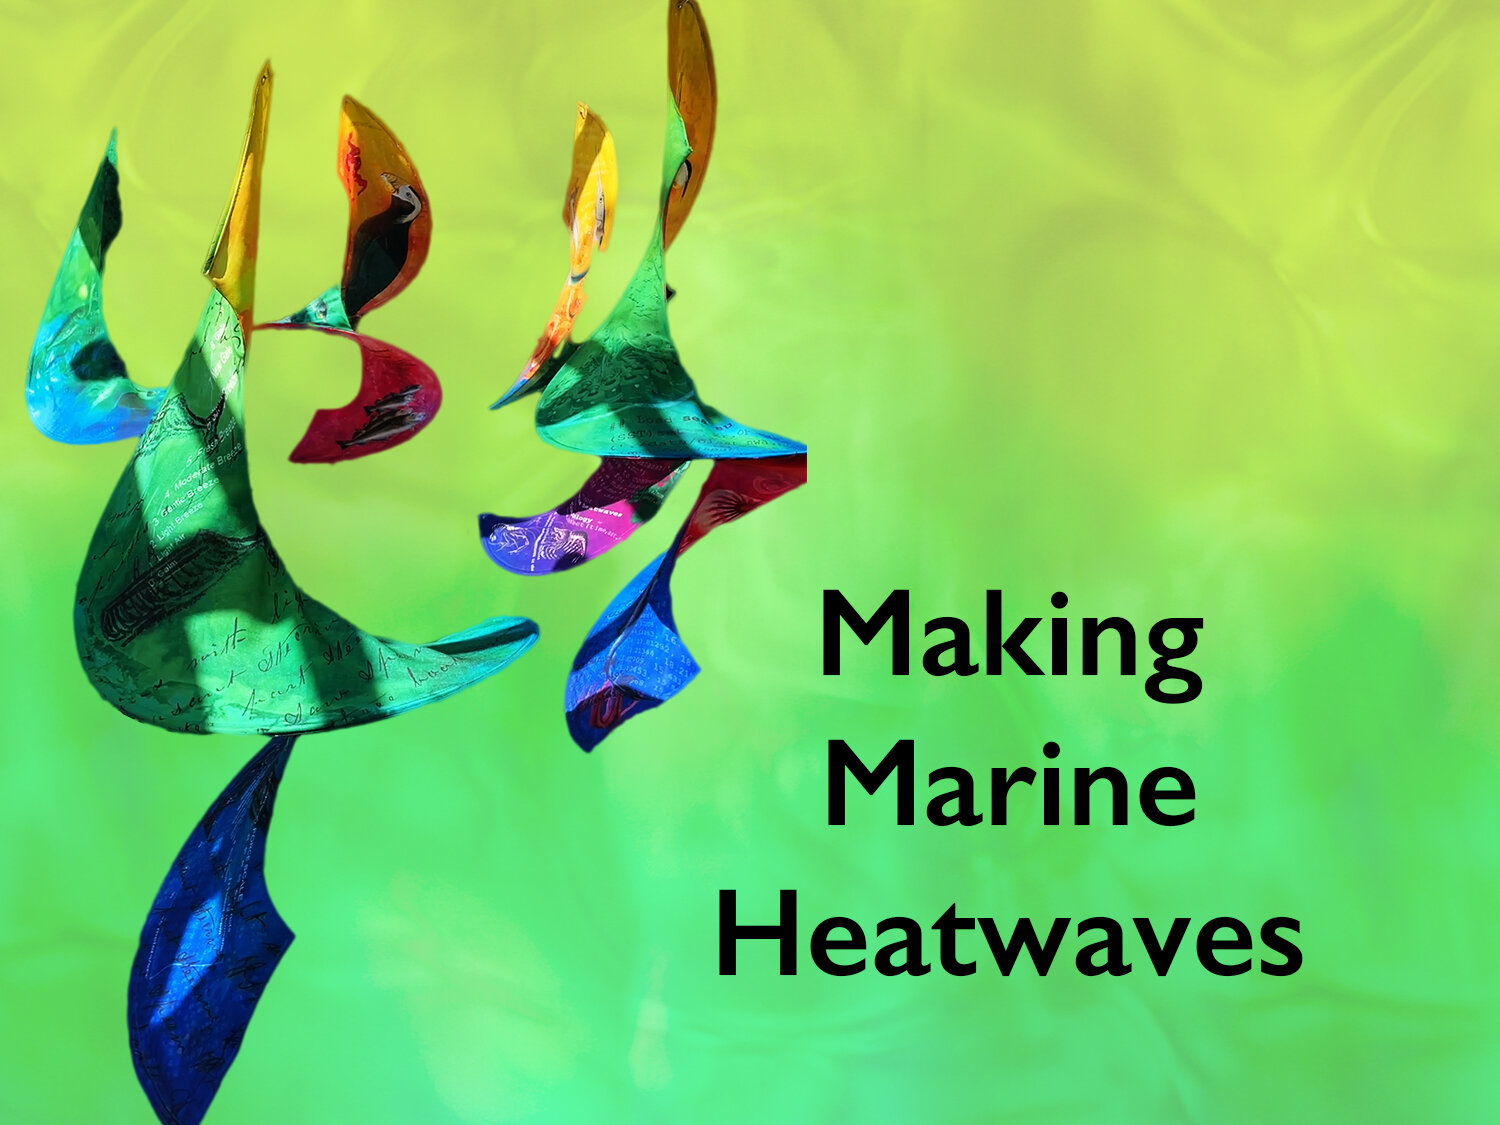
Marine Heatwaves: An Art & Science Collaboration
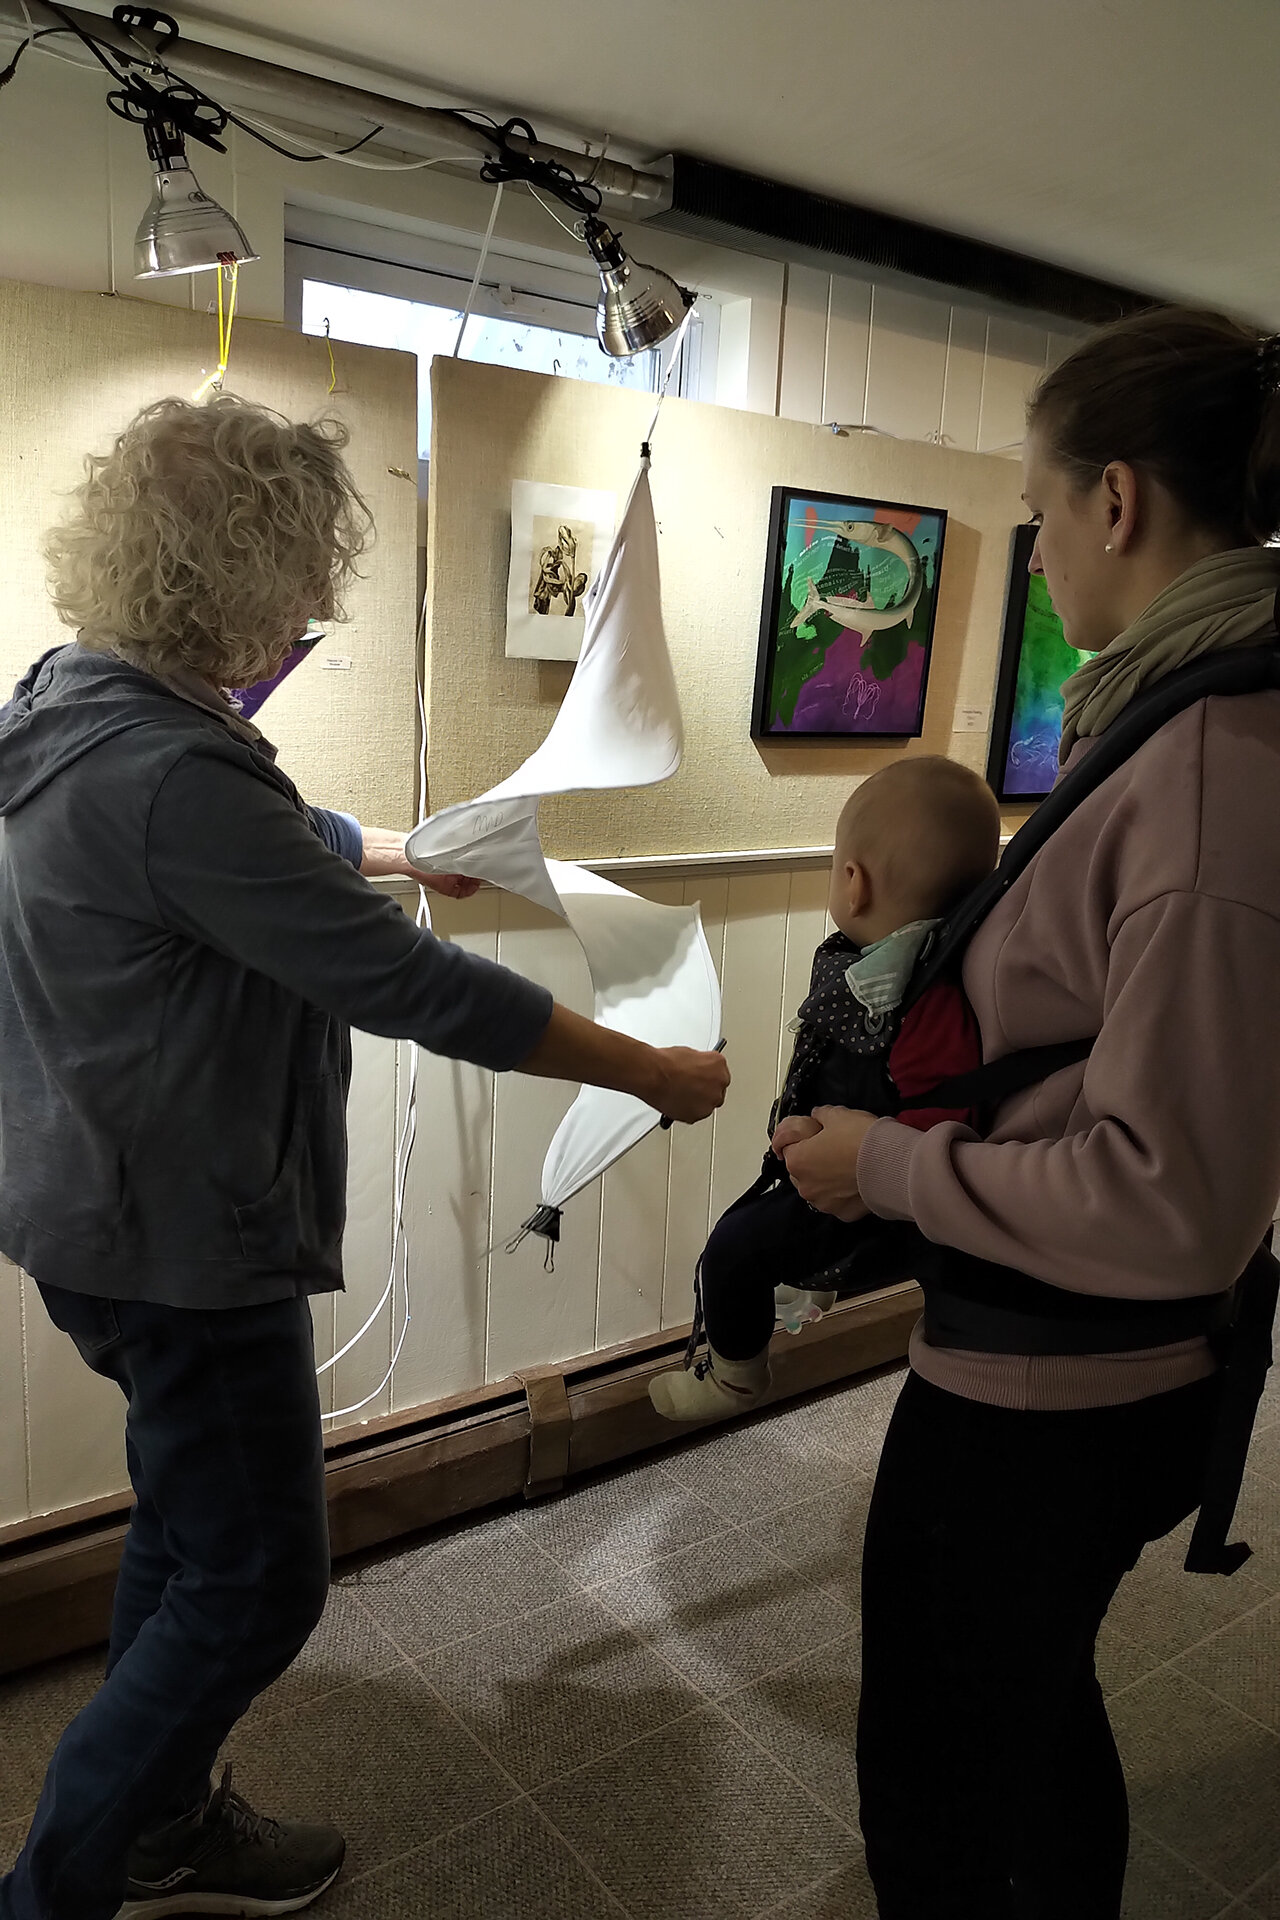
Debut Exhibit: June 2021 at South Coast Surface Design. DATMA Water 2021
About the Project
Marine Heatwaves is part of SYNERGY II - a collaboration between Art League RI (ALRI) and the Woods Hole Oceanographic Institution (WHOI) to express ocean research through art. The project pairs scientists with artists to collaborate and create a ‘common language’ using the arts to illustrate and communicate the science. It has been my privilege and pleasure to work with climate scientists Caroline Ummenhofer and Svenja Ryan.
The project began with months of conversation. Caroline and Svenja explained their research, shared books, technical papers, and podcasts. We examined the scientific and artistic process, and were surprised and delighted at the similarity of so many aspects of our work. We spoke in-depth about the challenges of communicating big ideas and numbers in meaningful ways and how we all had to be effective storytellers.
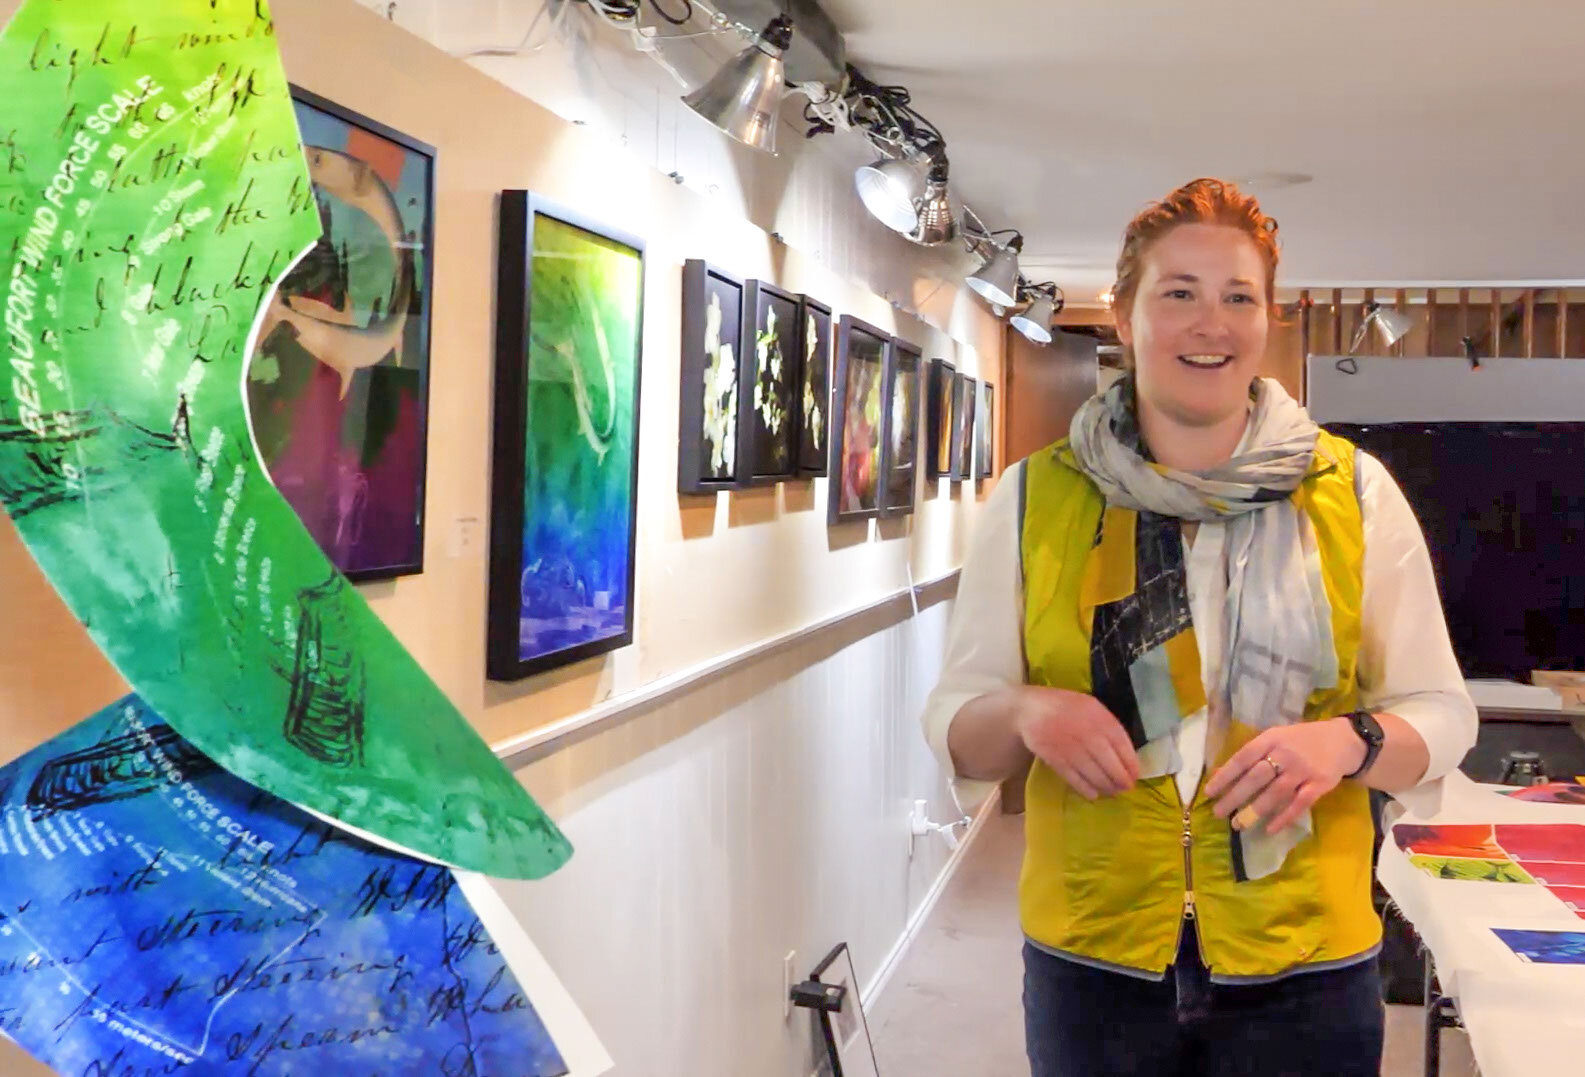
The Art
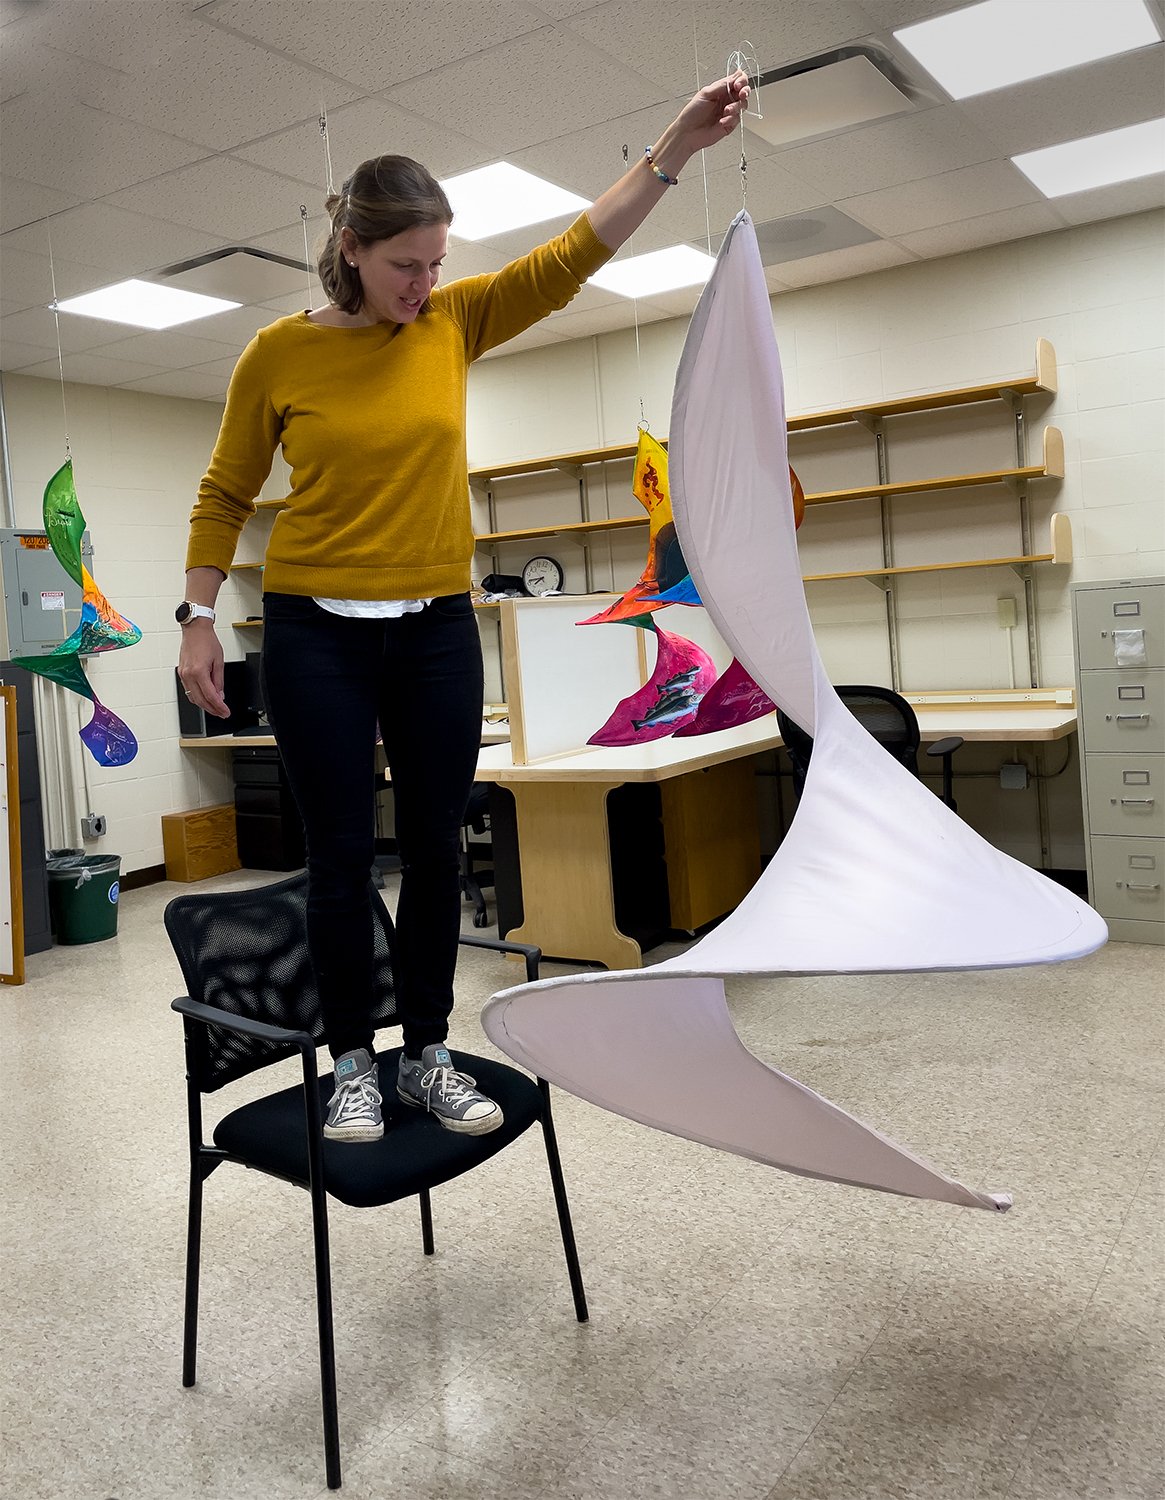
Very early in the project, I knew that whatever I created, it needed to be big and it needed to move. My partner scientists deal with big ideas, big systems, and big data. They are seeking patterns in constantly shifting environments.
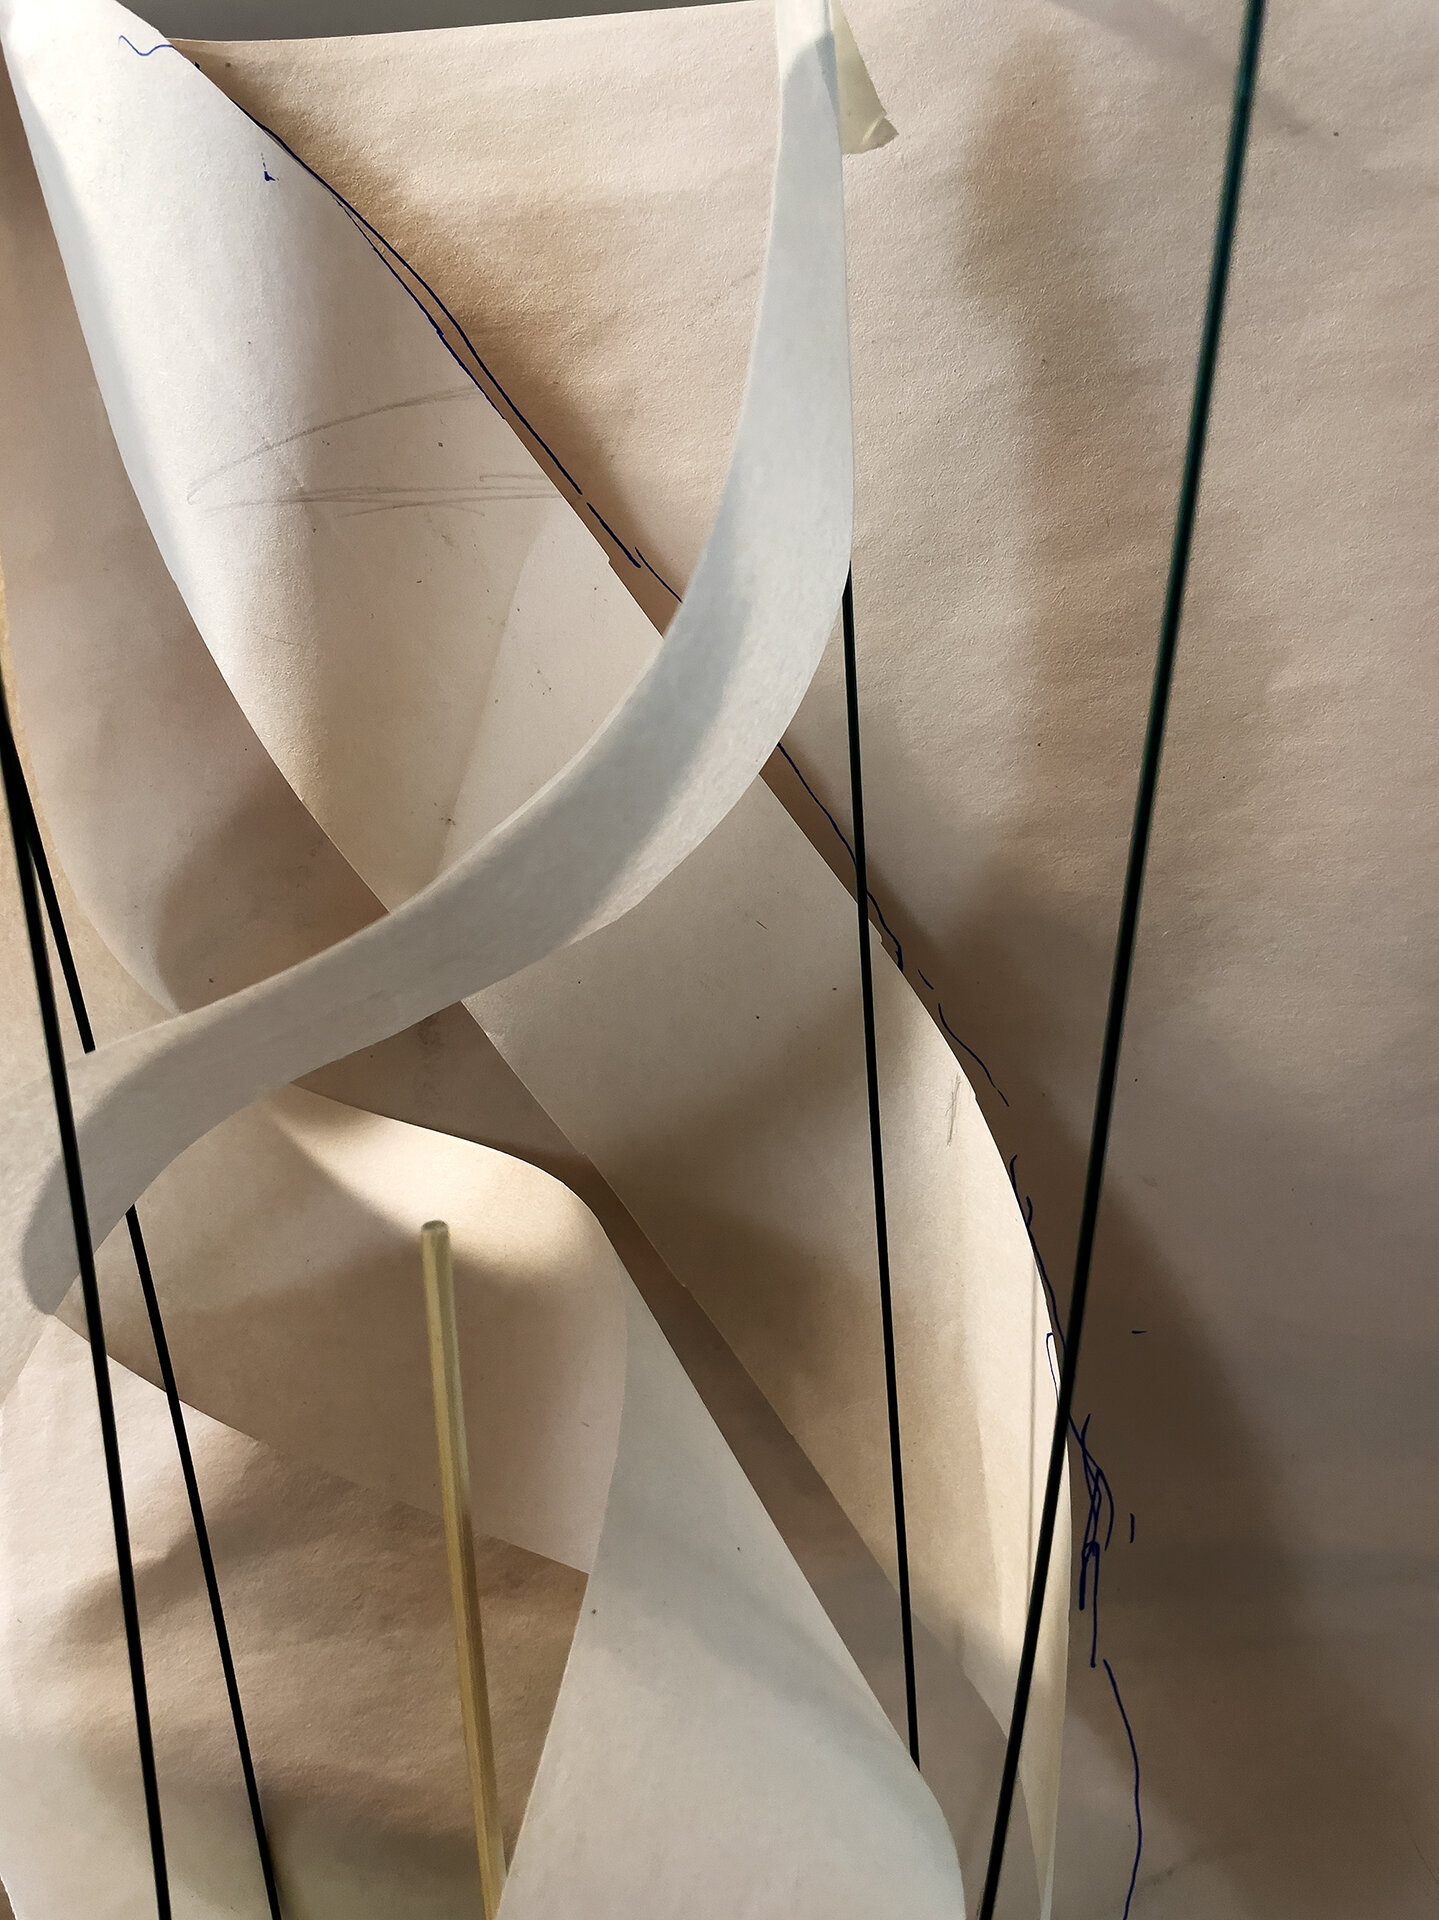
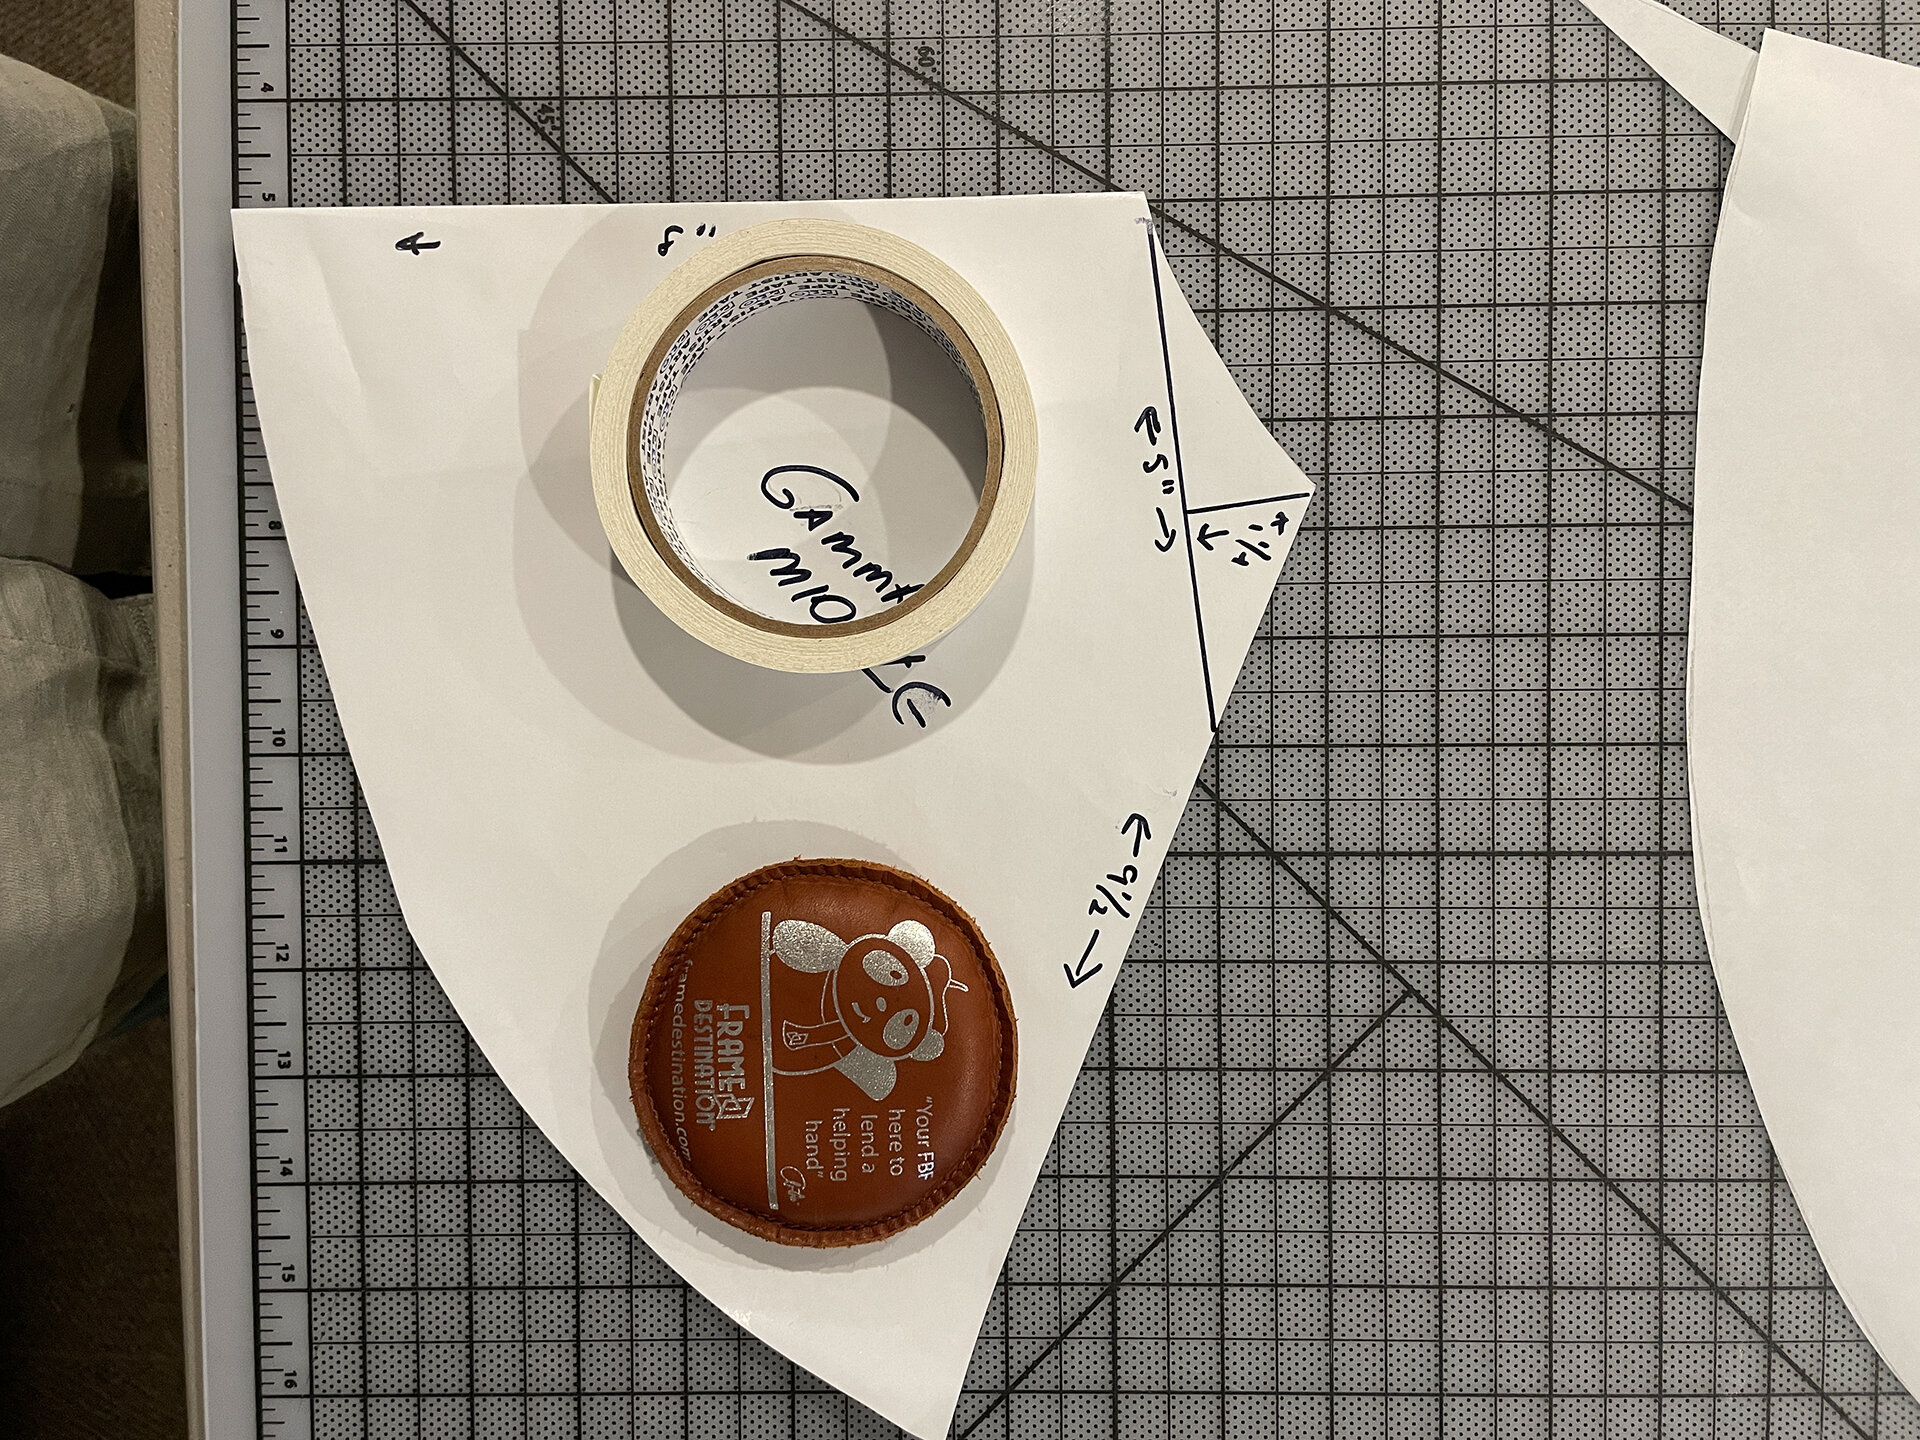
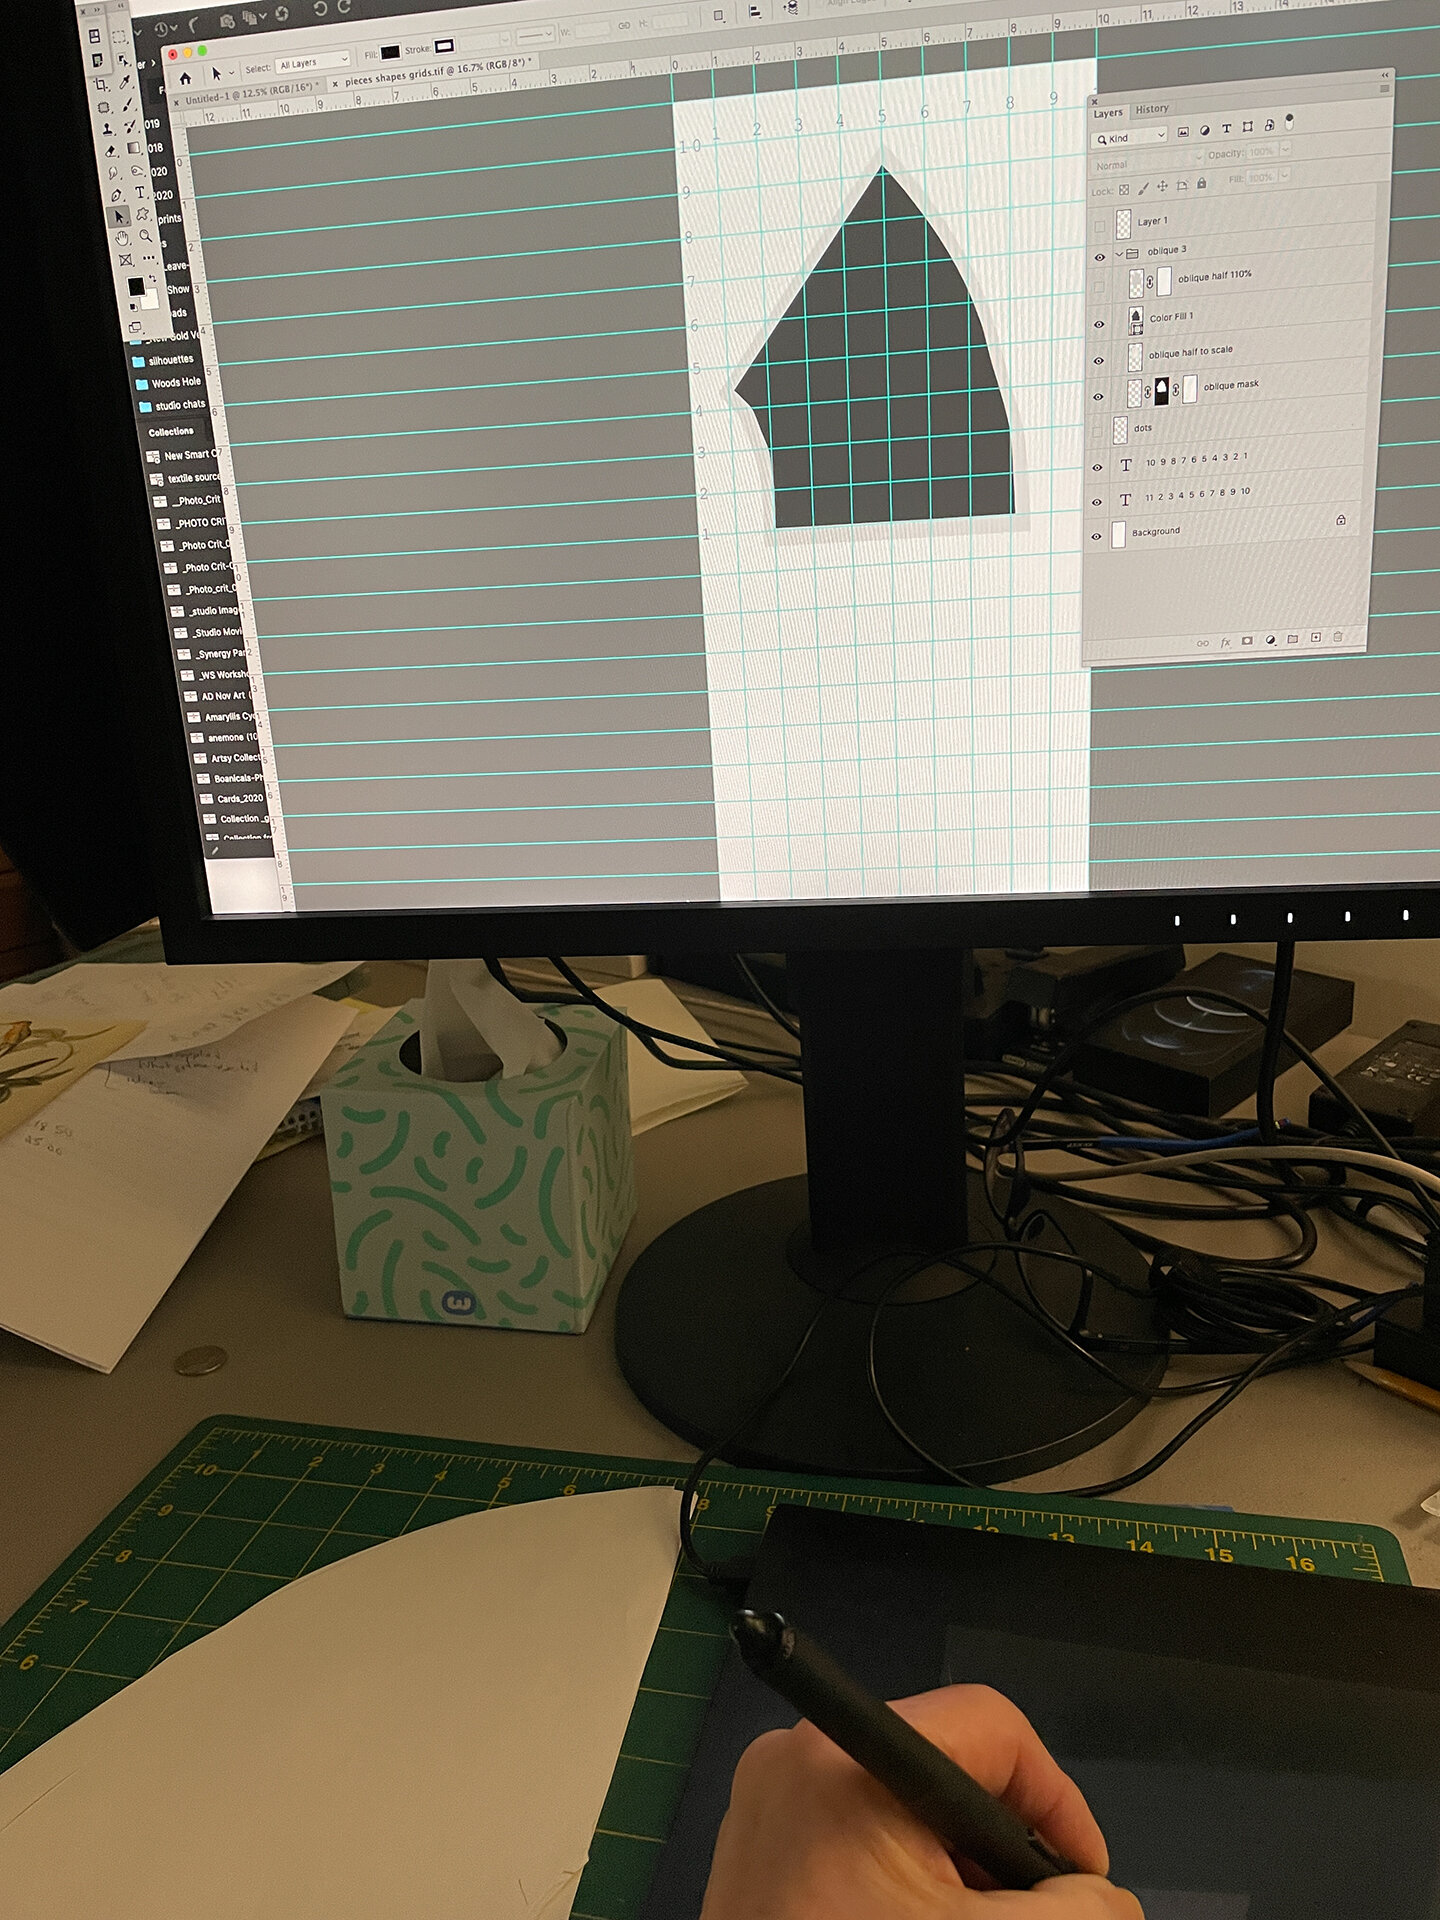
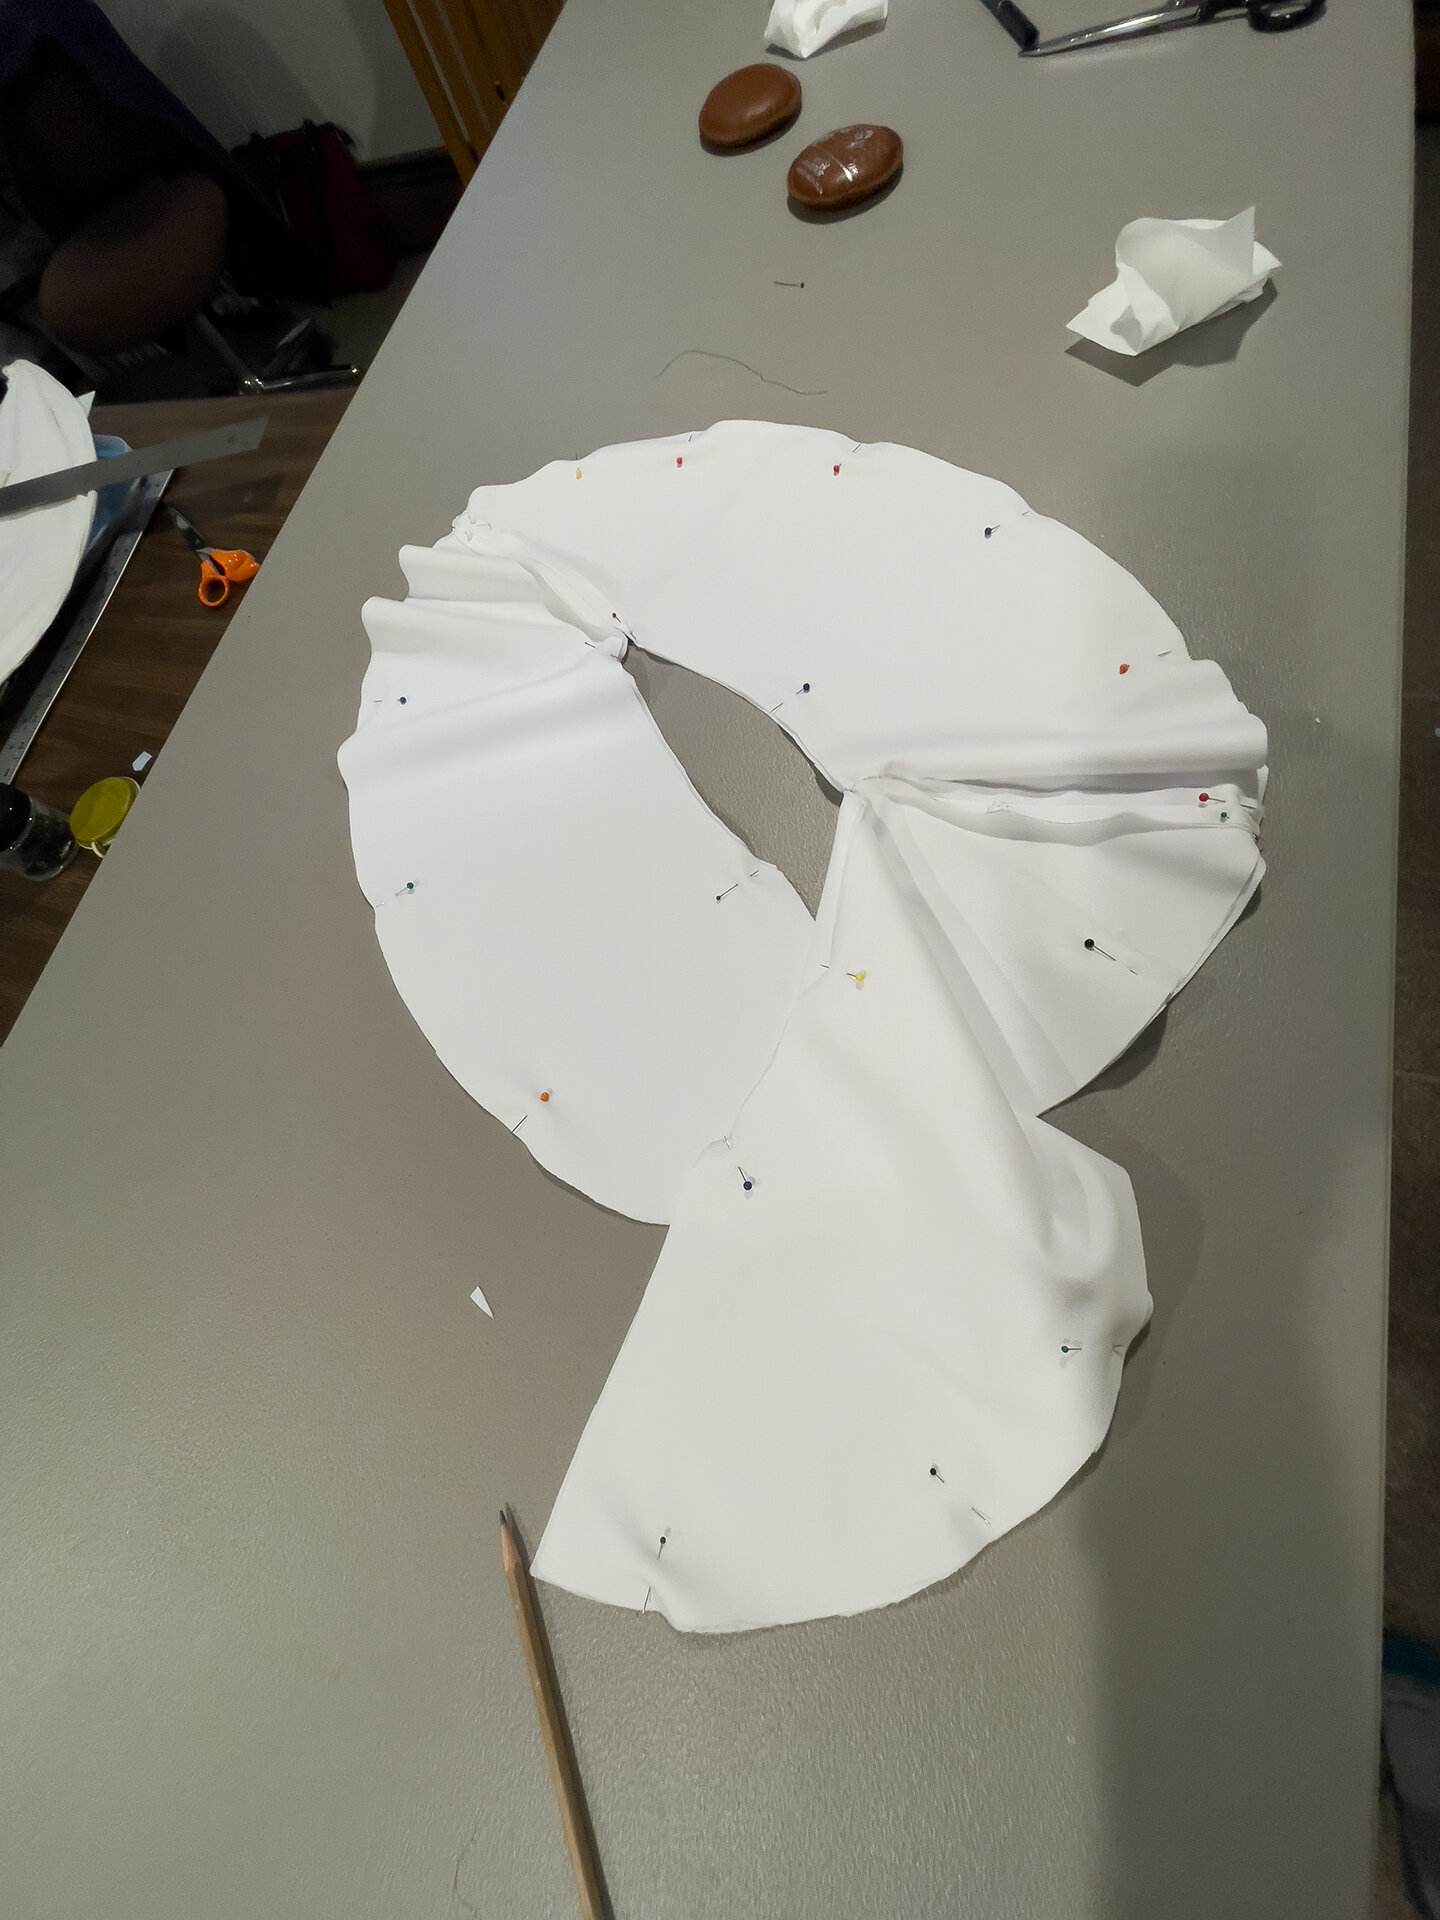
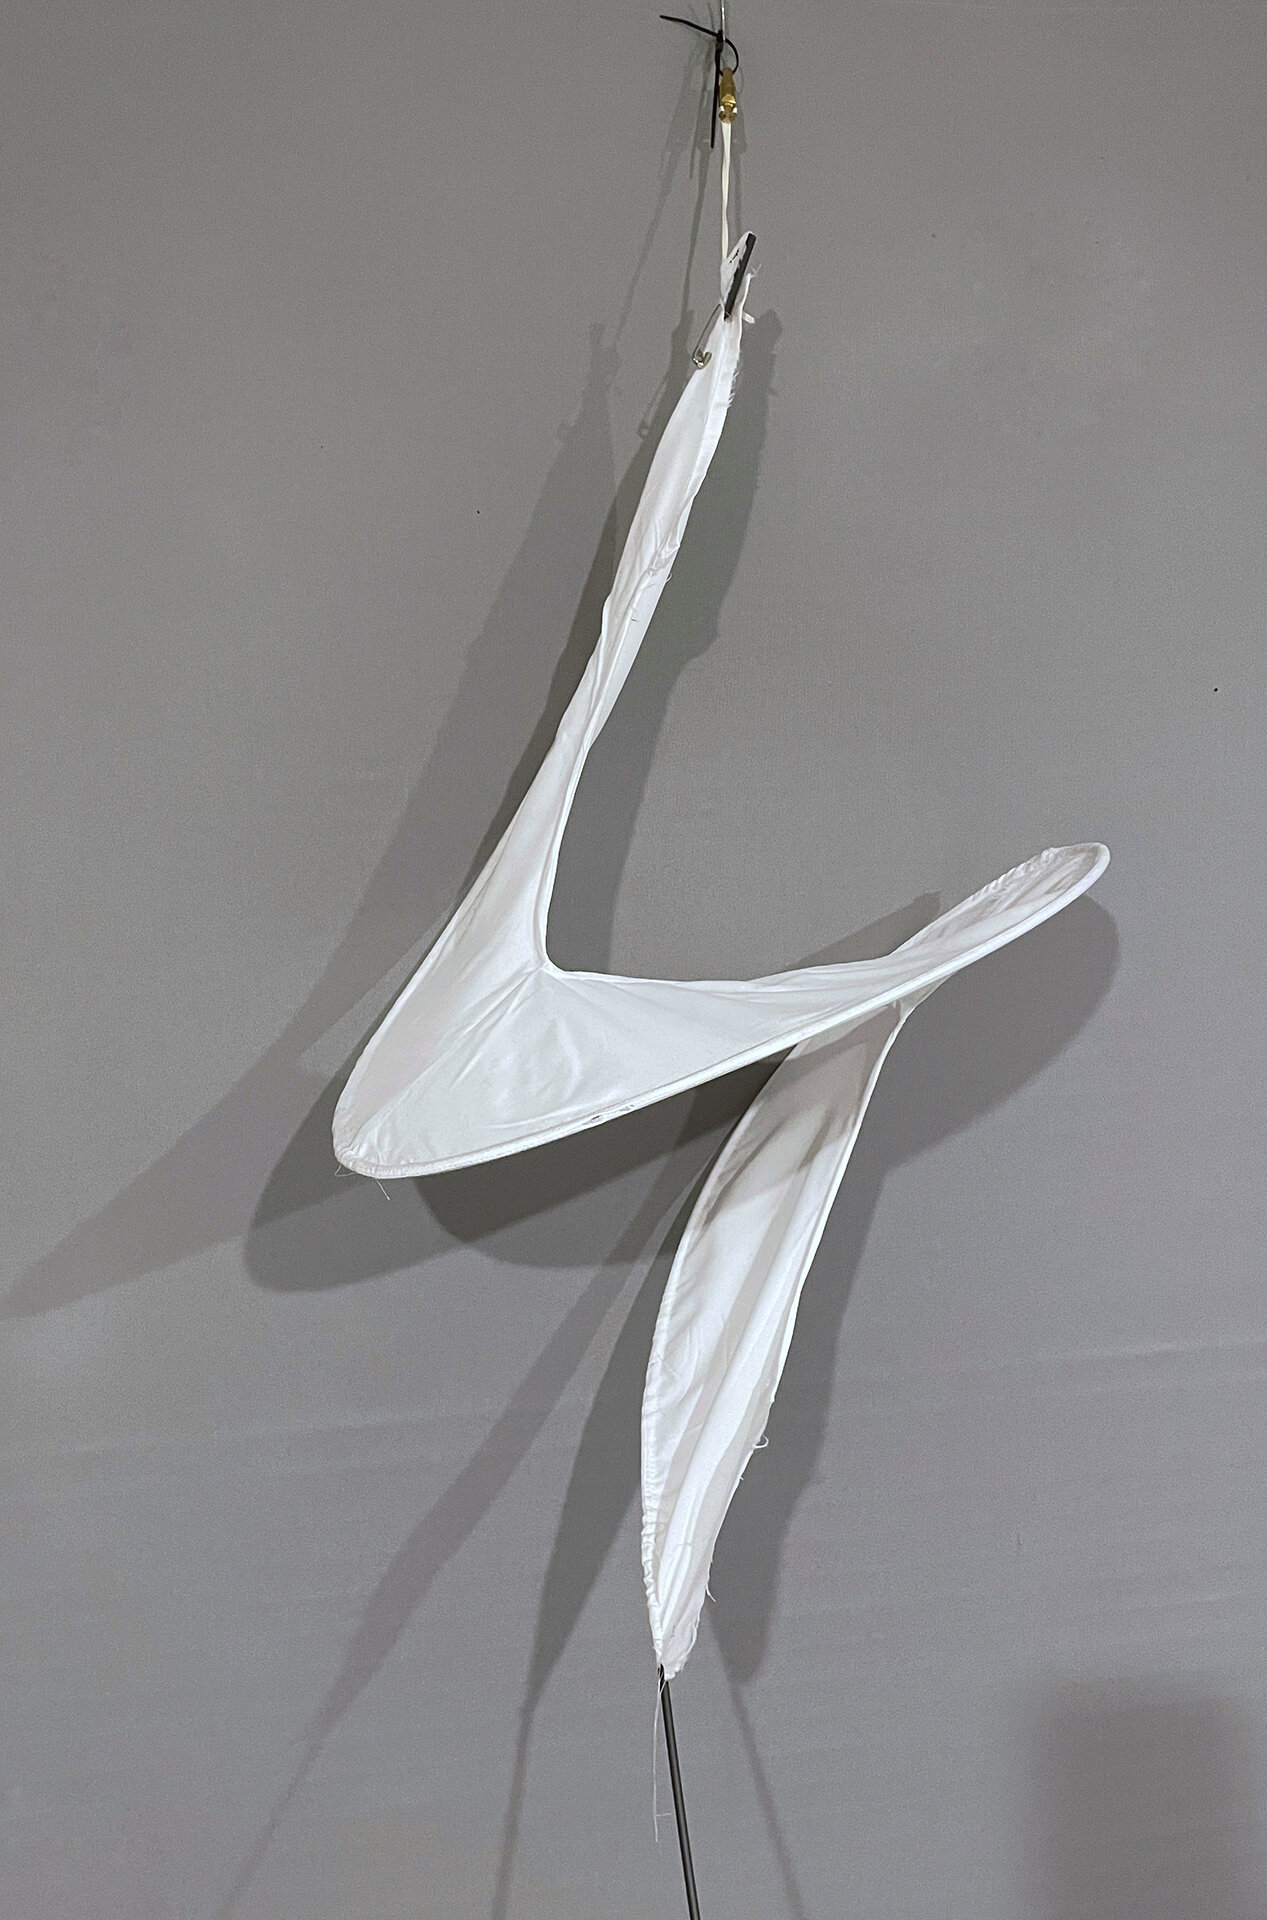
My artistic interpretation needed to come out of the frame, off the wall, and be kinetic. The waveforms in the animation below inspired the form for my marine heatwaves. It was easy for me to imagine moving, swirling heatwaves, but executing my ideas took a great deal of experimenting with materials, pattern design, tensile strength, and rotation. There was lots of trial and error and many failed efforts before I settled on a form that would: move in both predictable and unpredictable ways, was simultaneously simple and complex and could be viewed from a distance and also invite the viewer in for a closer look.
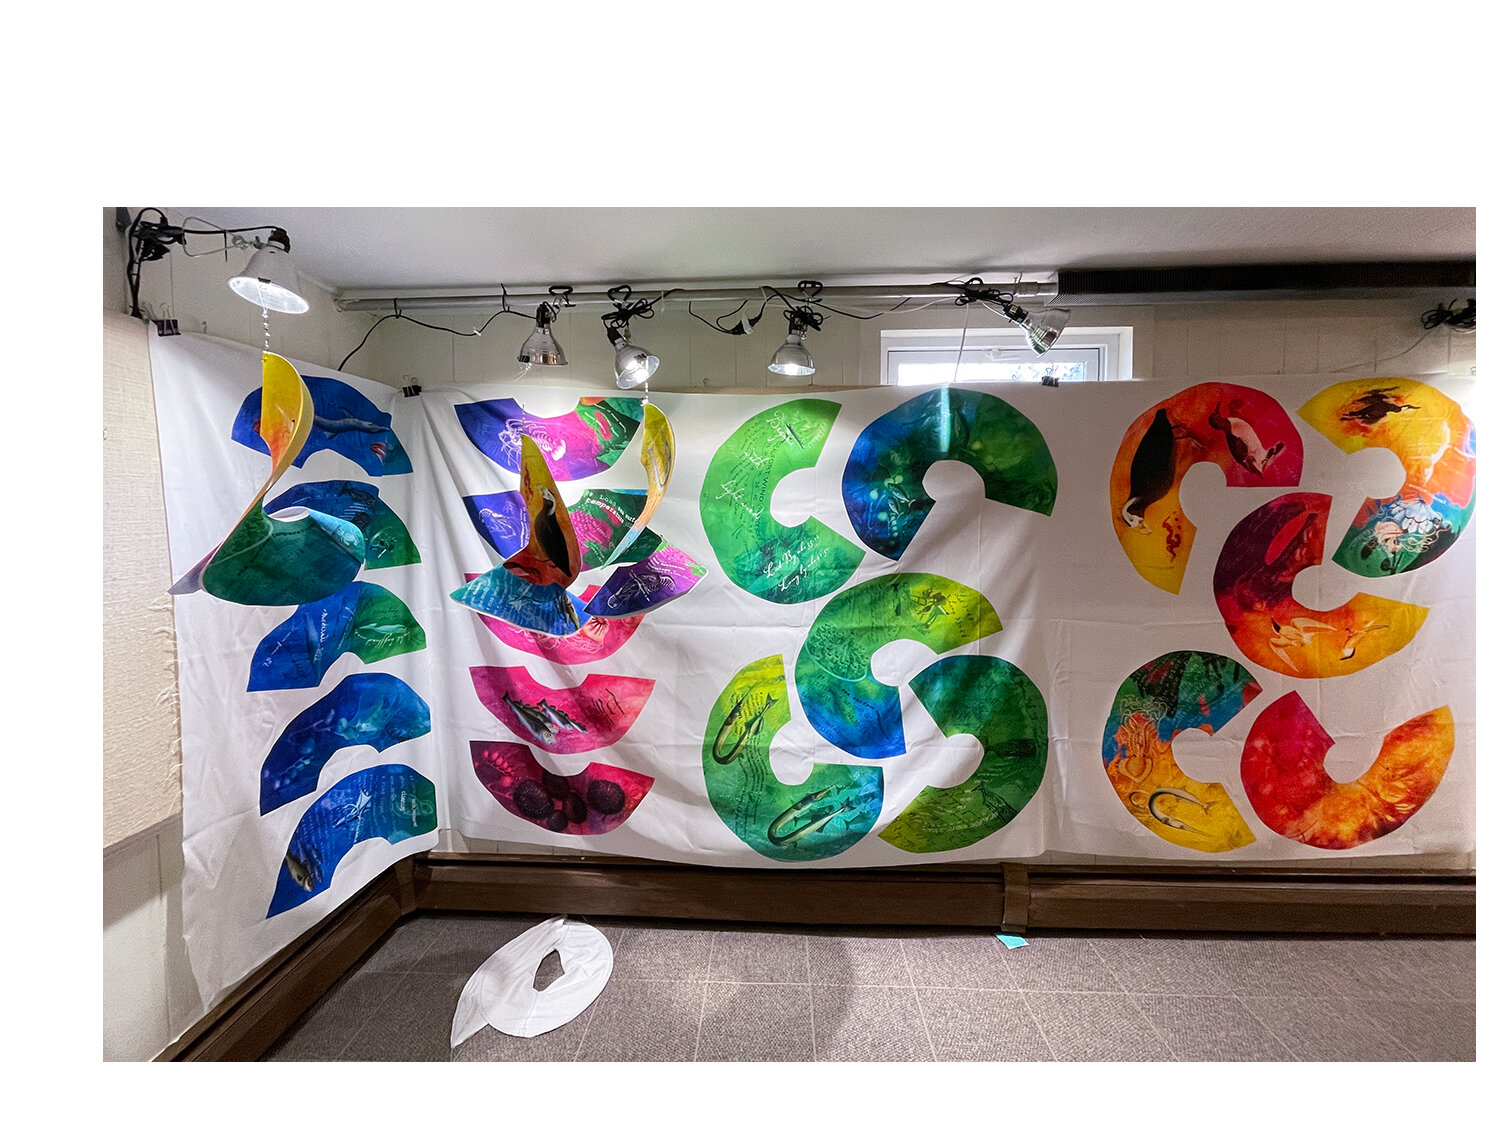
Once I settled on the “heatwave” form I could begin thinking about the imagery. During the reading and research phase of the project, I developed quite a library of images of critters around the globe that have been impacted by heatwaves, charts, maps, and satellite photographs of these extreme events in our ocean. I spent hours reading scanned copies of old whaling ship logs that are being mined for weather data to be used in Caroline’s climate models. But I did not have a unifying theme for all this imagery until I queried my partner scientists about their personal motivation. I asked Caroline and Svenja, “What is the driving force that makes you dive into these massive data sets, travel to polar regions, and seek out new data from the past?” They both answered, “the thrill of discovery.” These climate scientists are direct descendants of naturalist explorers who used ink and pen for journal entries and illustrations. Today, the tools are different, but the quest is the same.
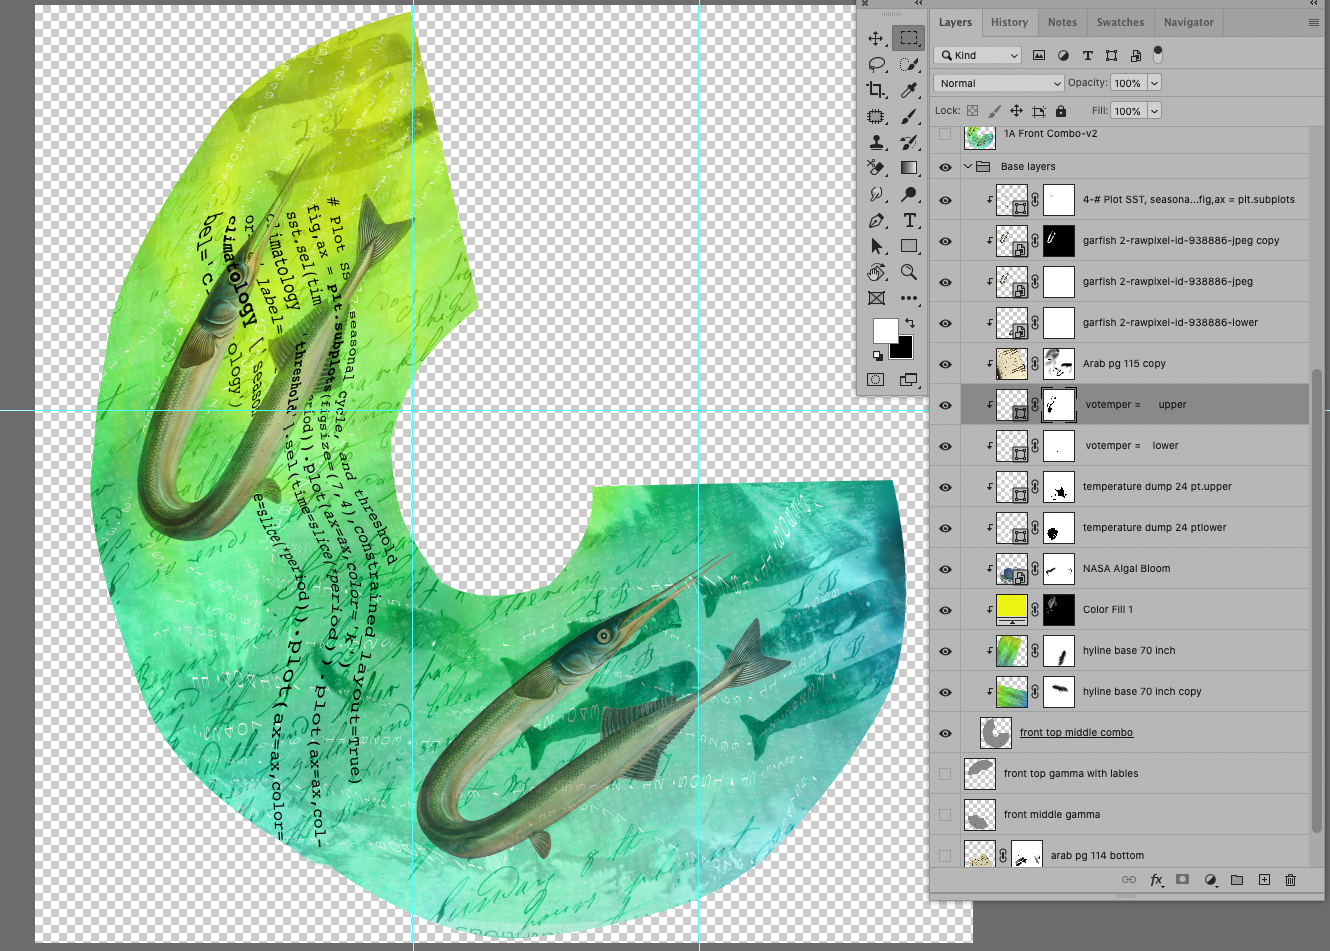
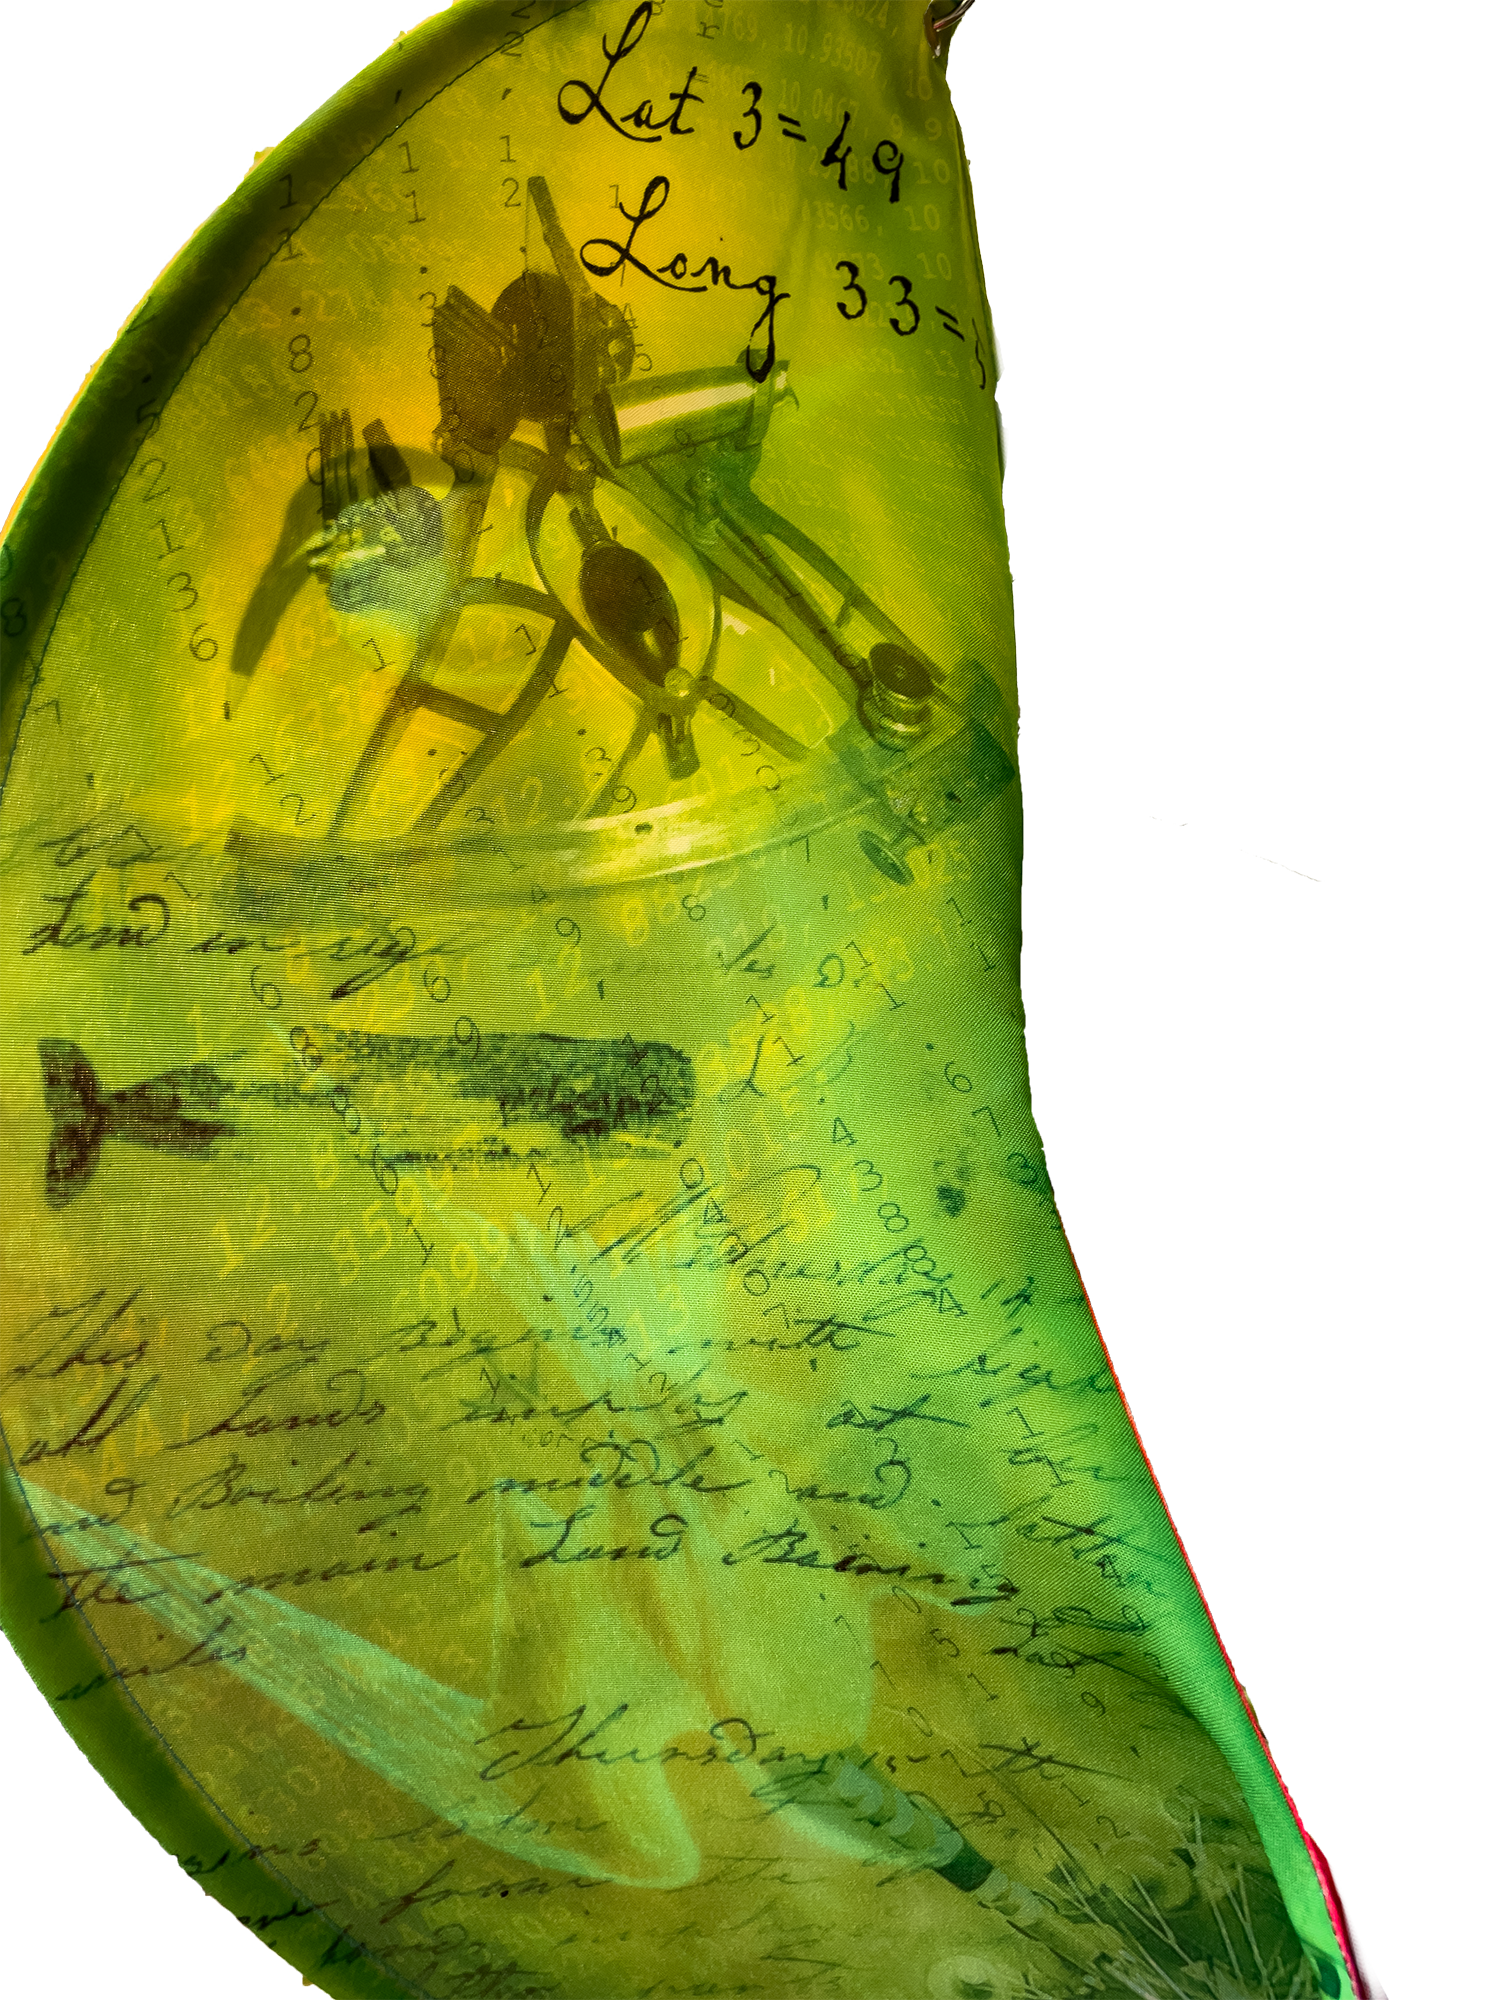
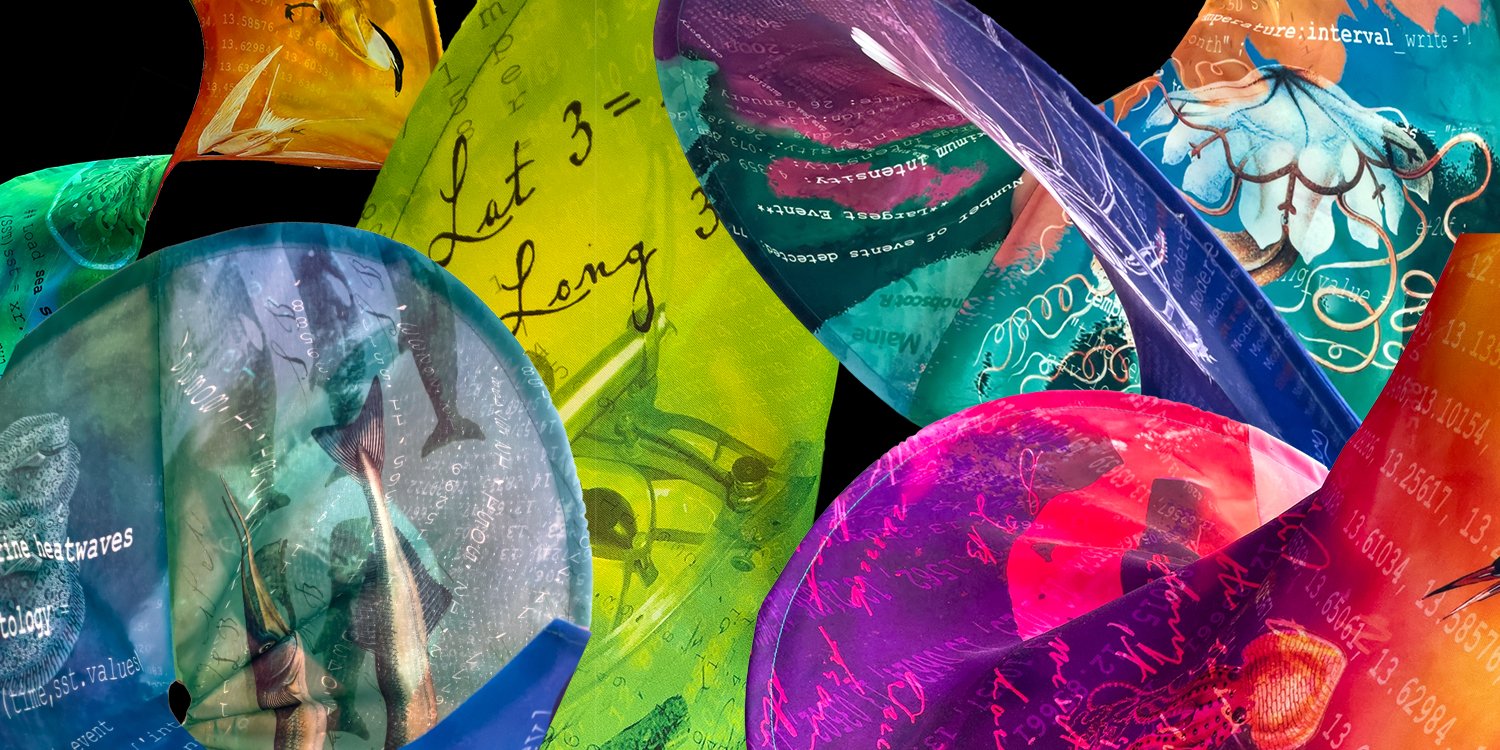
With this theme of exploration and discovery, I began the process of collaging imagery onto the waveforms. Each heatwave begins with a color gradient that is commonly used to convey oceanographic data. One side has a yellow-to-blue gradient and the other side is the inverse color gradient. This decision was to assure that the colors would always be complimentary when the backside of a heatwave is in conversation with the front side. I wove data generated by Svenja’s computer models in and around 19th-century drawings of creatures impacted by marine heatwaves and layered computer code into whaling log entries that will become data points on the Beaufort Wind Force Scale. To create depth and texture I embedded graphs, charts, scientific instruments, and satellite photos of marine heatwaves into the design. The heatwave imagery is intentionally both large and small scale. I wanted the sculpture to intrigue viewers from a distance and invite them to come close and explore. This macro/micro viewing experience mirrors how both scientists and artists dive deep into rabbit holes on their way to seeing the big picture.
The Science
Caroline Ummenhofer focuses on understanding the ocean's role in the global water cycle, in particular extreme events like droughts and floods. Her interdisciplinary research combines data from global observations and computer simulations with environmental archives around the world. Of particular interest to me is her project to extract descriptive weather data from whaling logs. A key goal of Caroline's research has been to bridge the gap between ocean and climate science and its impacts on society: she aims to provide practical outcomes of use to stakeholders and translate the implications of her research findings to the broader public.

Marine HeatWaves off the New England Coast in 2012
Svenja Ryan studies Marine Heatwaves (MHW) off the New England coast. A marine heatwave is an extreme event in the ocean in which temperatures are significantly above the norm. MHW can have an enormous impact on coastal communities and ocean ecosystems. In the oceanographic world, MHWs are the “new kid on the block.” They have only recently been “discovered.” For her work Svenja utilizes many different tools and datasets depending on the research question; including ocean models, ship-based measurements, satellite data, data from marine mammals and floating robots that profile the subsurface ocean.

Project Next Steps:
Scale-up Heatwaves for exhibitions in 2022 & 2023;
Develop ancillary educational content;
Complete MIT Abstract to be shared with students in Nord Anglia International K-12 schools around the globe.


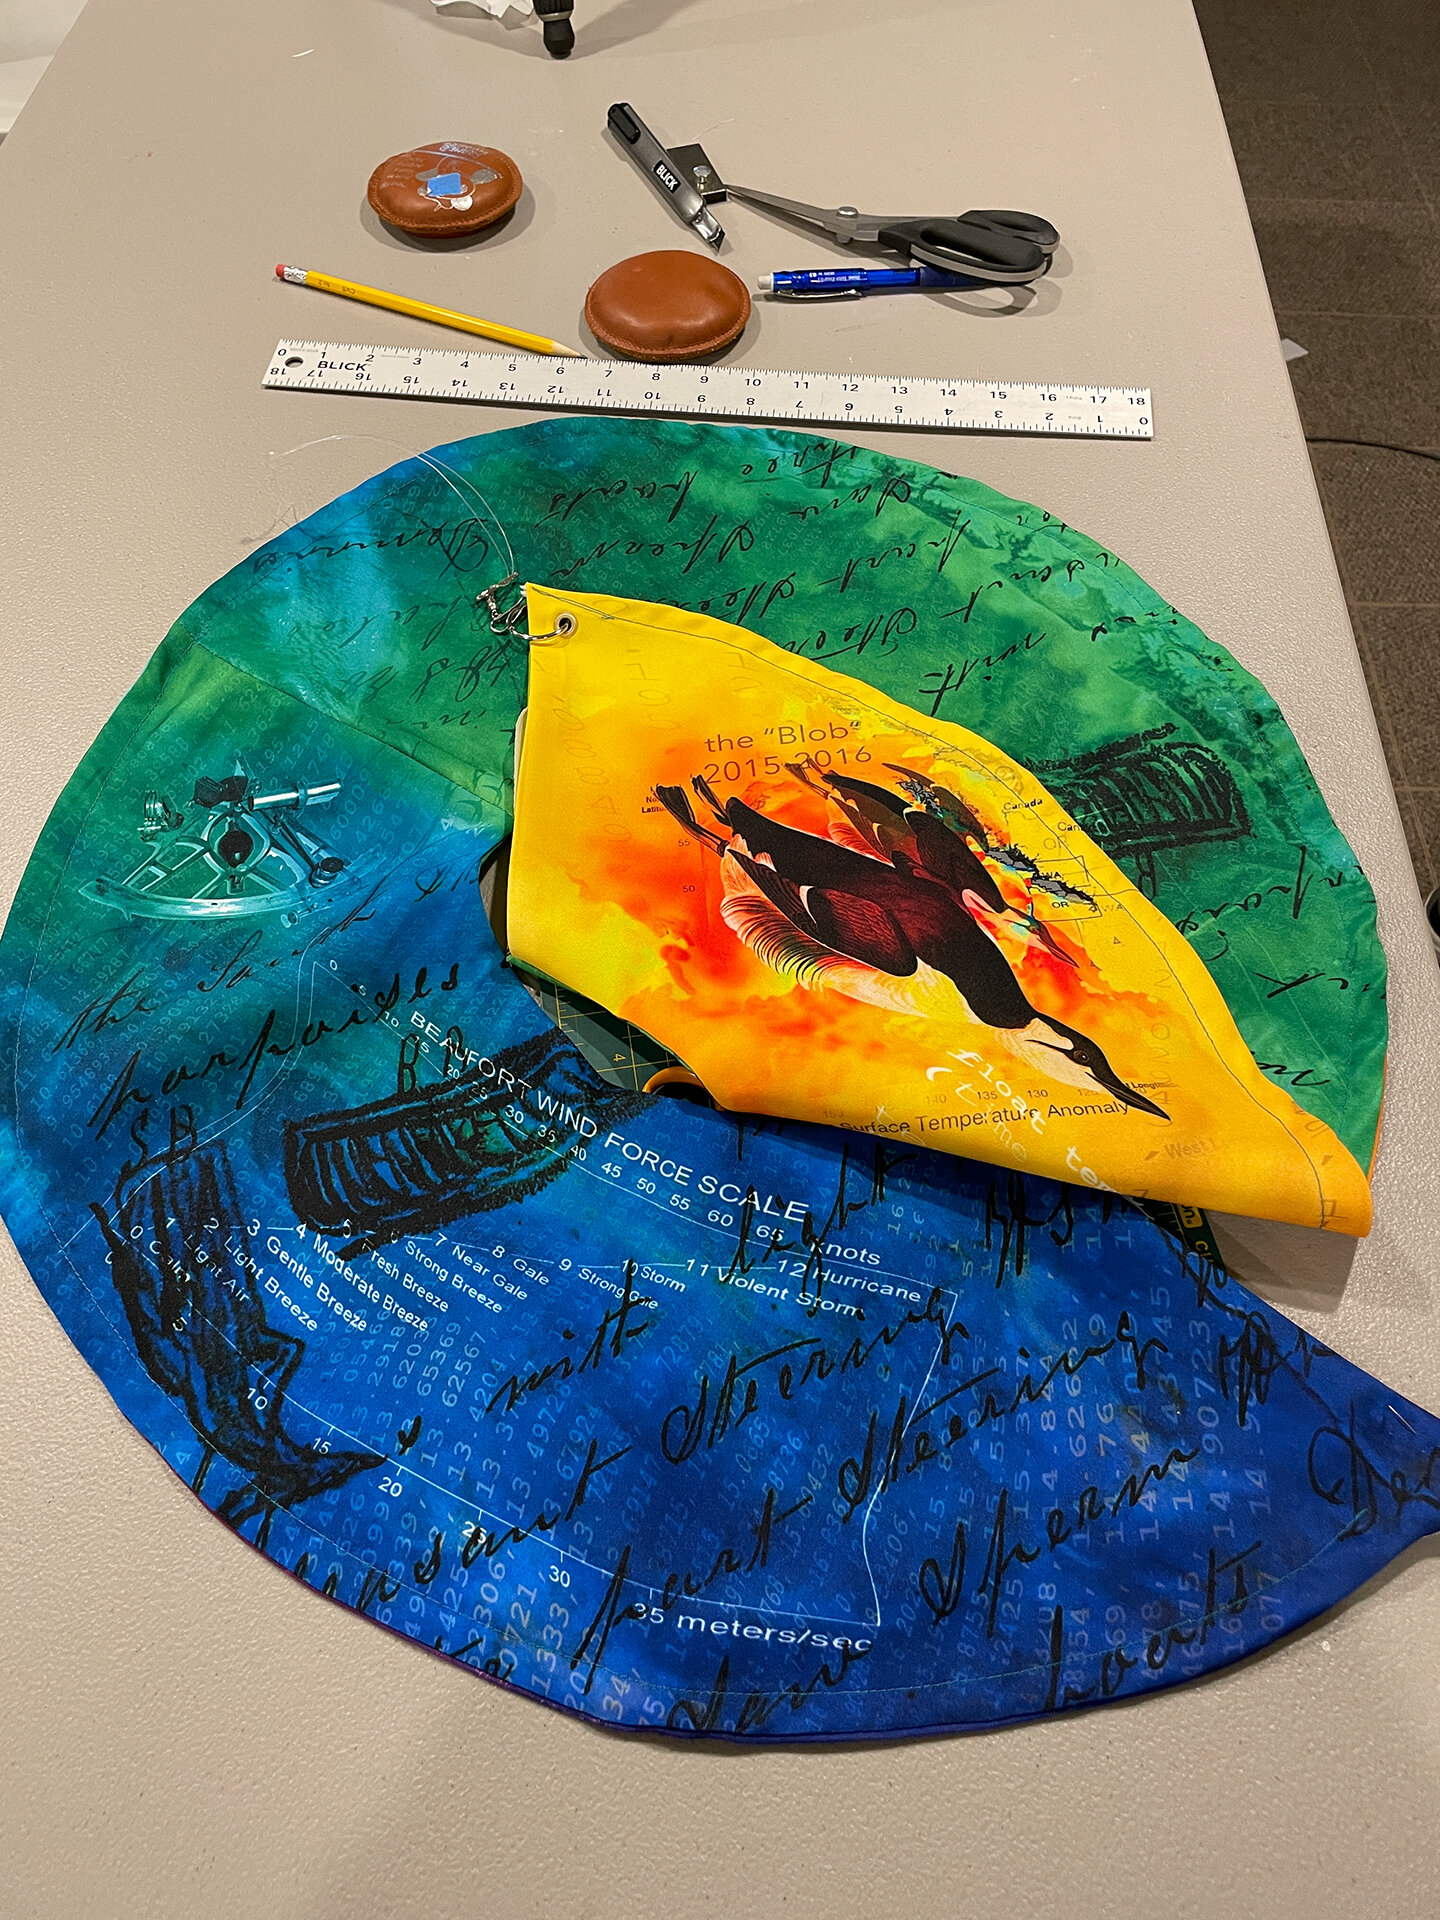
Close-ups of heatwave details.
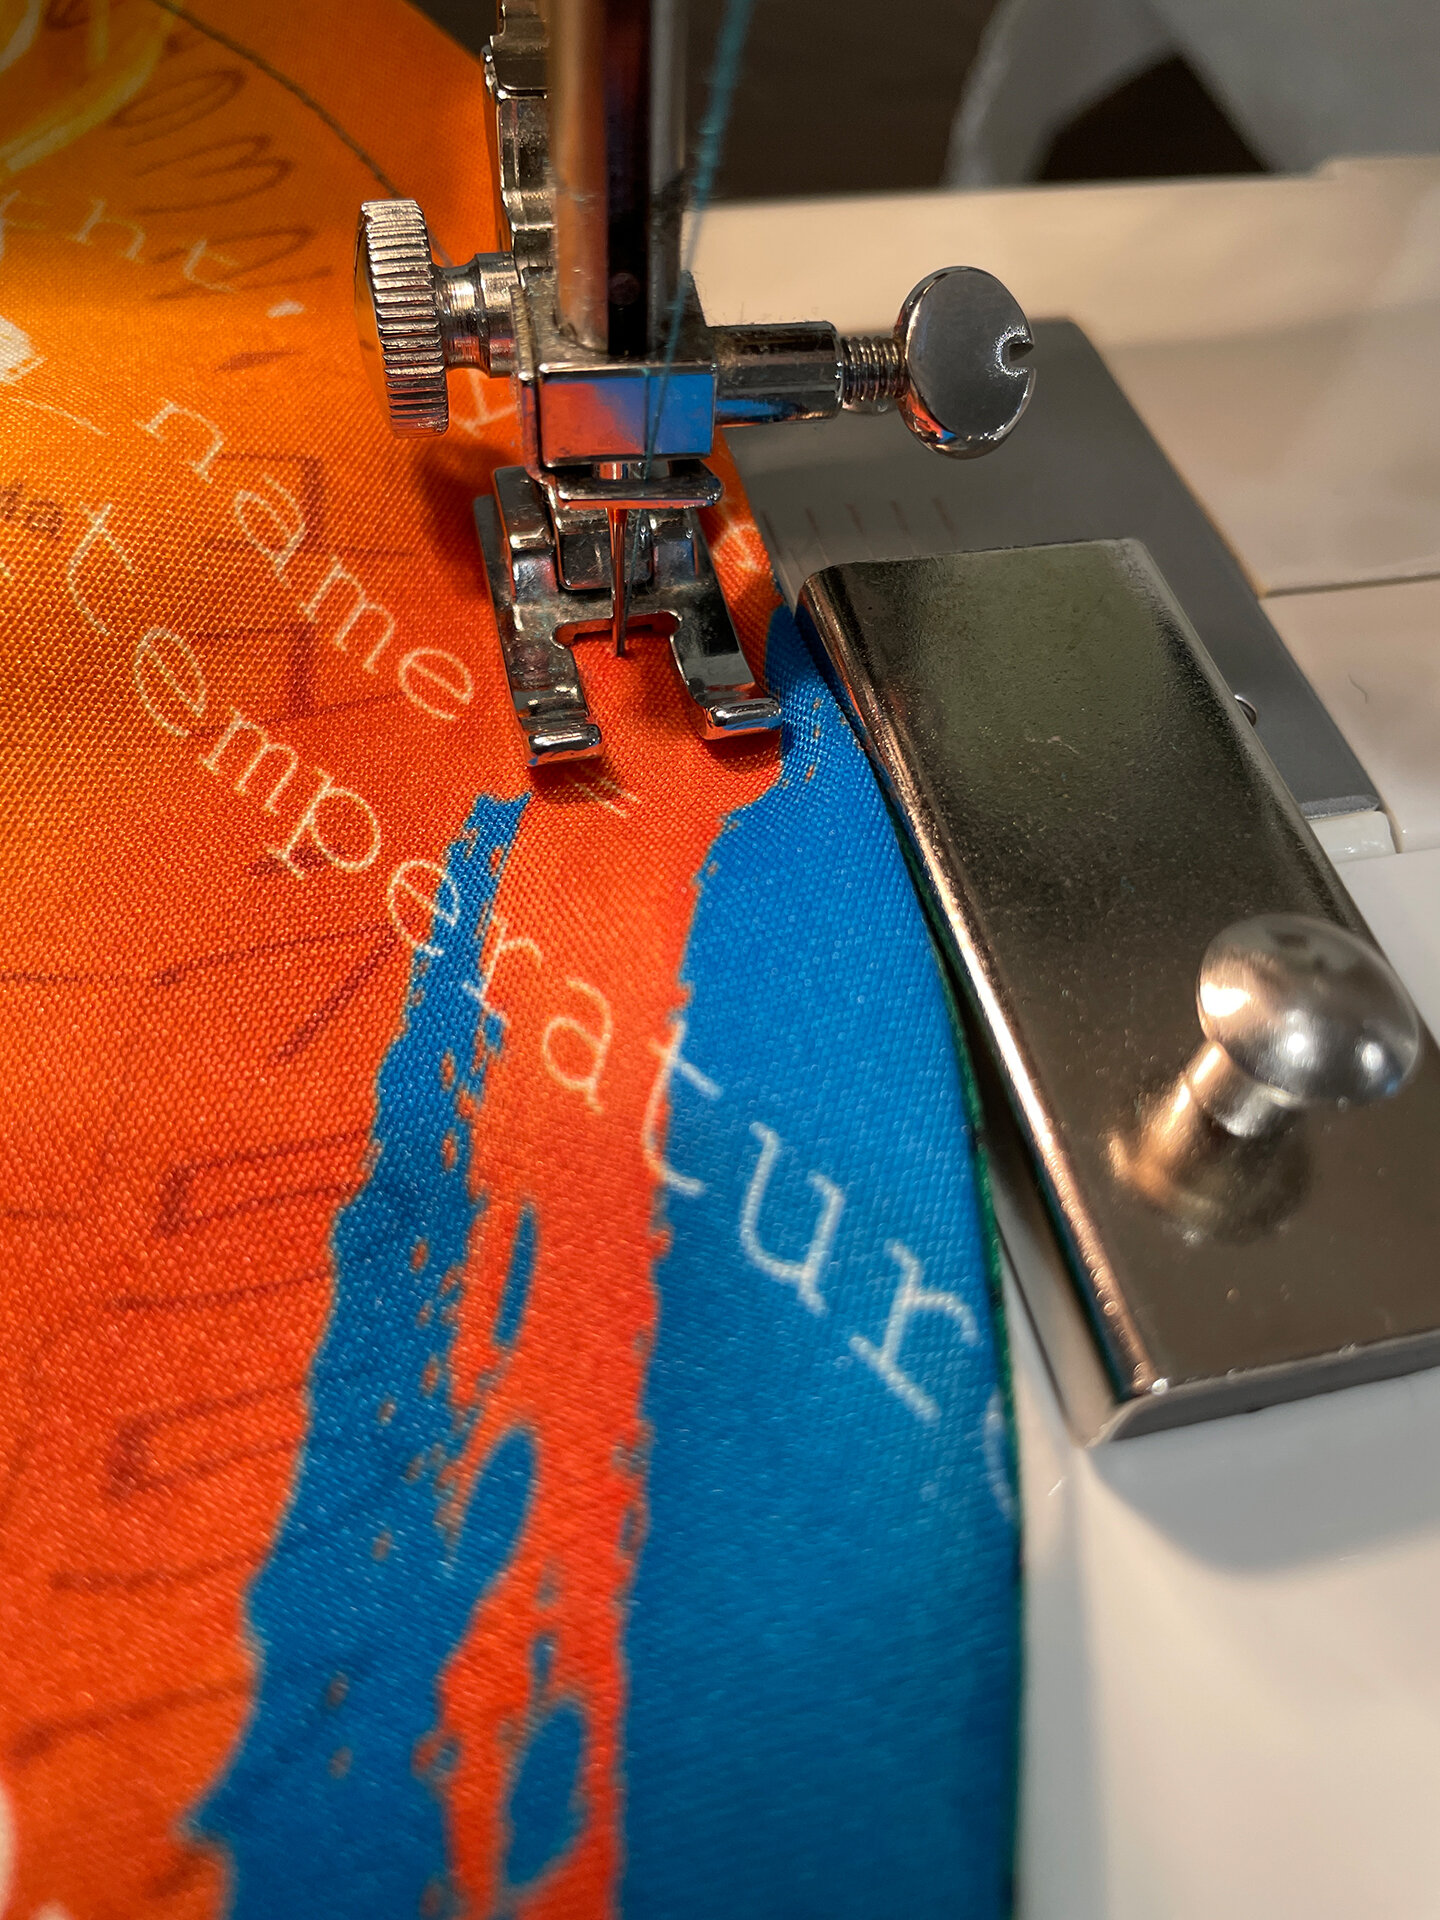
Making Marine Heatwaves- A Slideshow